NFIRS Data Quality Dashboard

Data Quality Score - a mathematically derived value that ranks the following metrics of data quality into a single score.
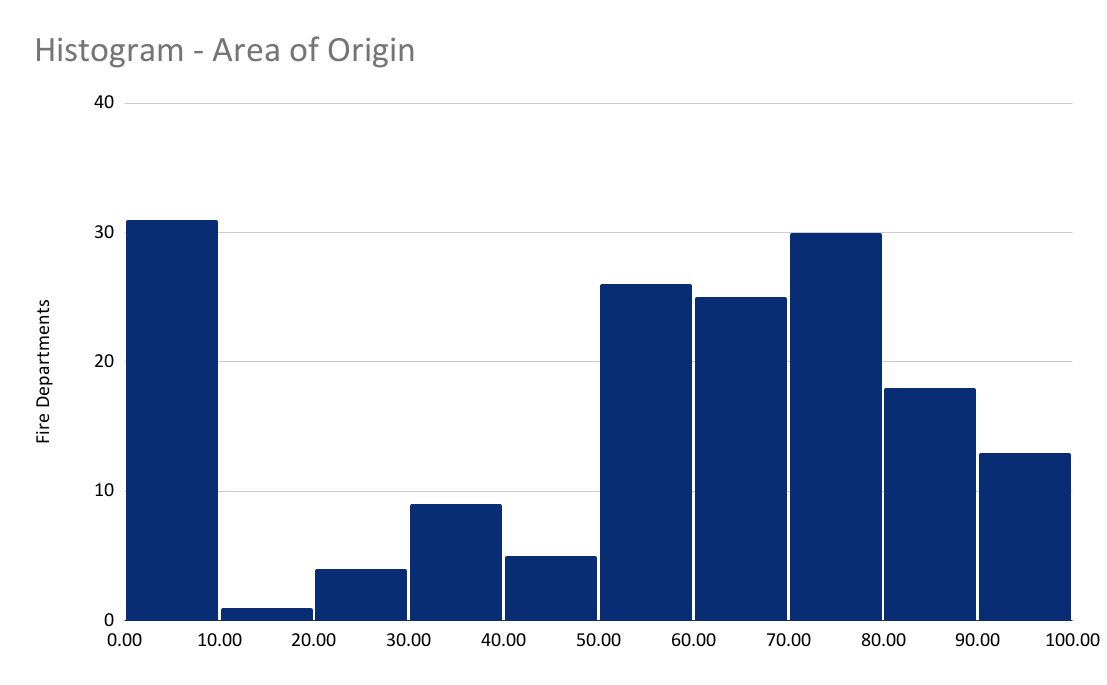
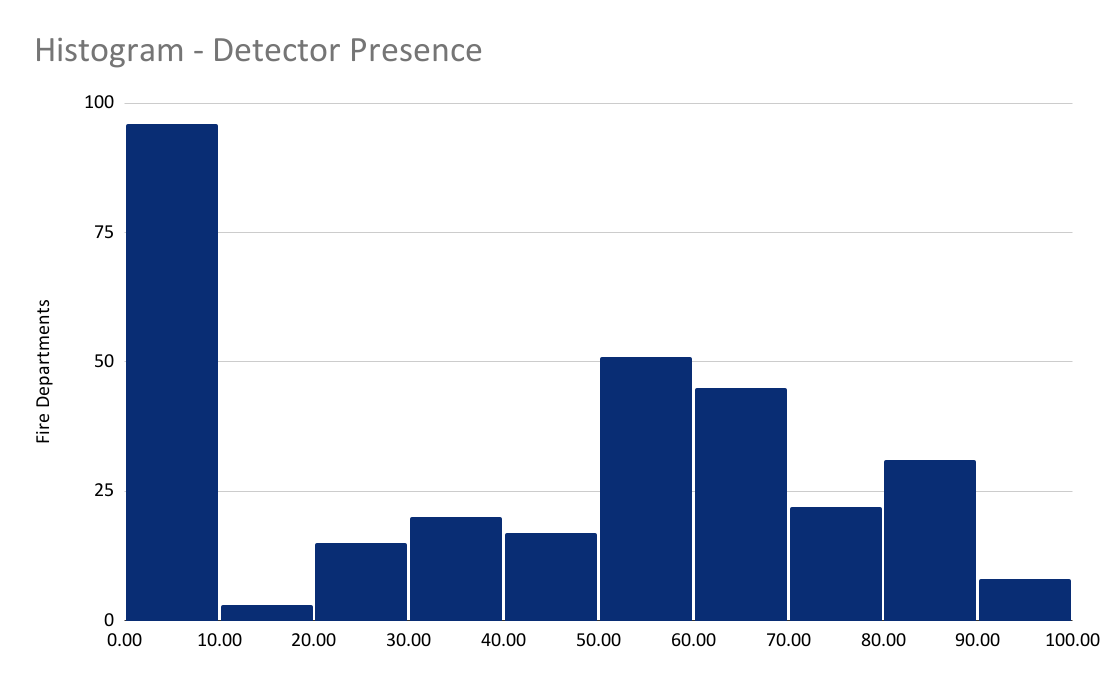
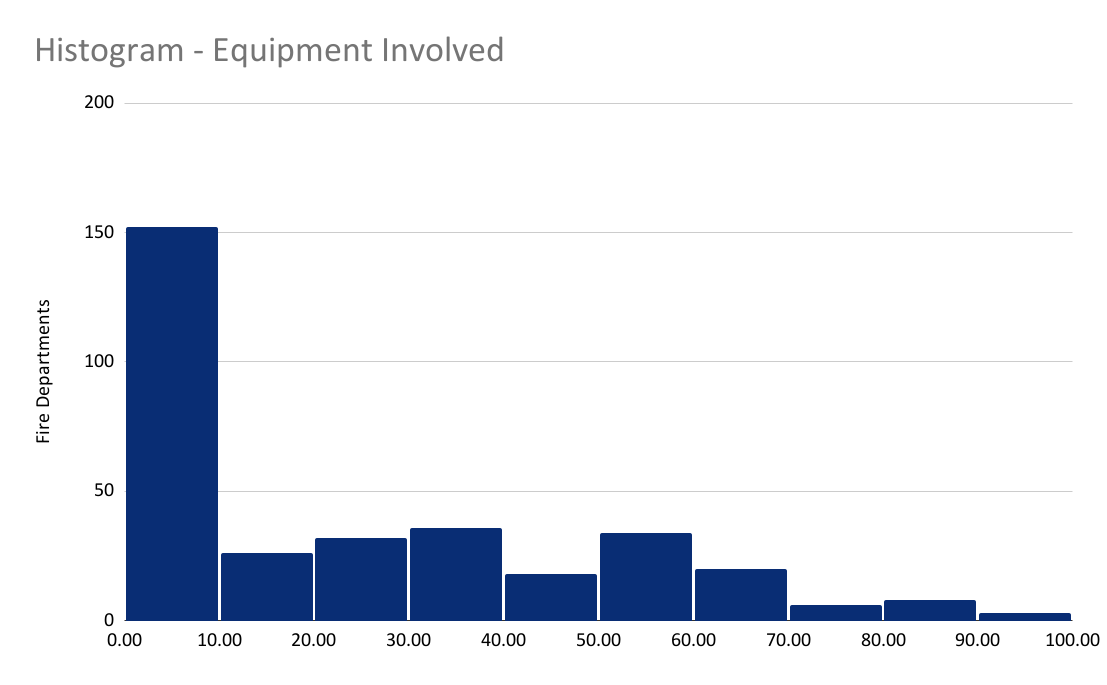
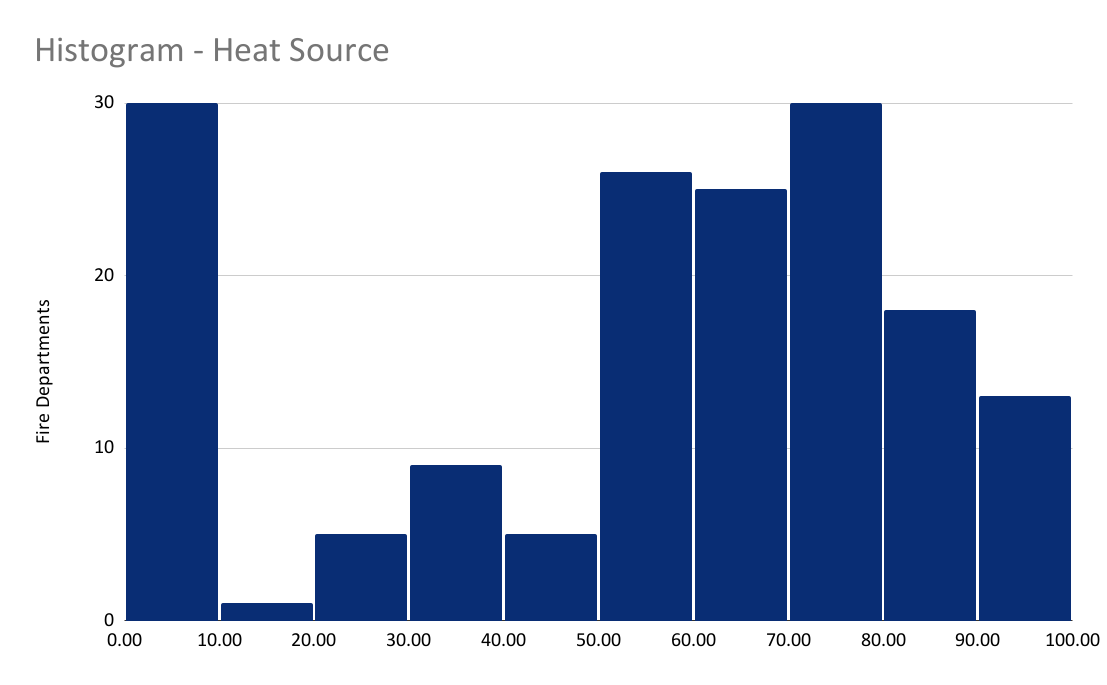
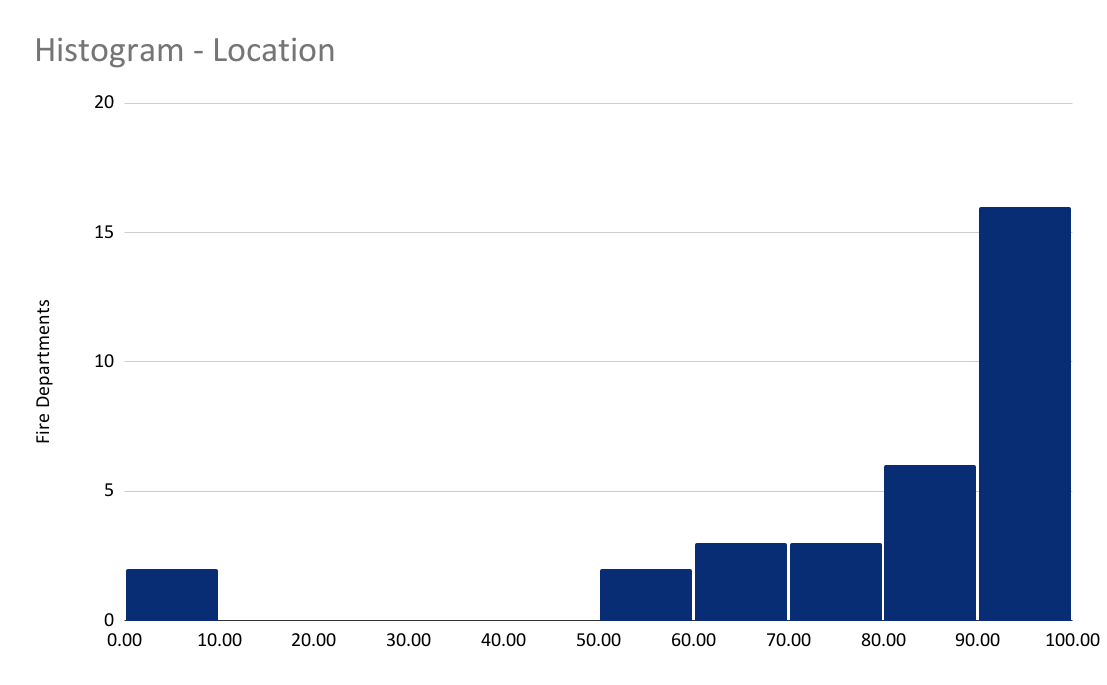
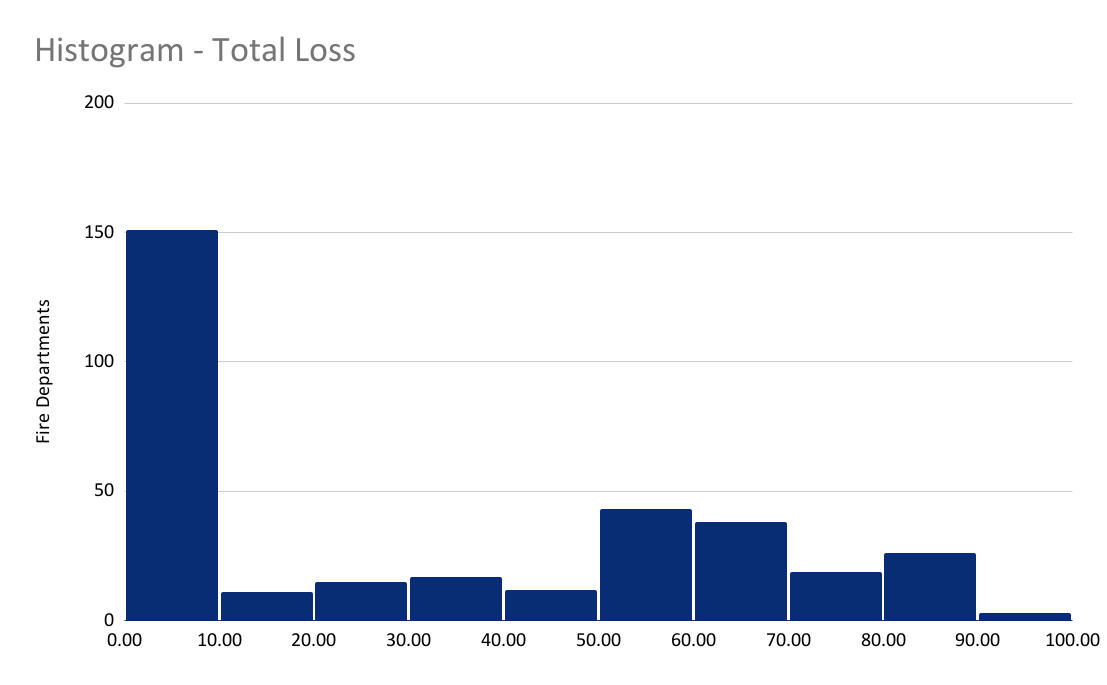
34(Data Quality Score) = 1(Location) + 1(Area of Origin) + 1(Detector Presence) + 1(Equipment Involved) + 4(Fire Ignition Factor) + 4(Heat Source) + 4(Item First Ignited) + 1(Total Loss) + 14(Valid Incidents)
| Fire Department Name | Data Quality Score | Rank |
| Bolivar Fire Department | 100.00 | 1 |
| Springfield Fire Department | 96.47 | 2 |
| Pigeon Forge Fire Department | 95.59 | 3 |
| Hardin County Fire Department | 94.12 | 4 |
| Crossville Fire Department | 93.14 | 5 |
| Mount Juliet Fire Department | 93.14 | 6 |
| Brentwood Fire Department | 93.08 | 7 |
| Almaville Volunteer Fire Rescue Department | 93.05 | 8 |
| Oak Ridge Fire Dept | 93.00 | 9 |
| Chattanooga Fire Department | 92.98 | 10 |
| Fire Department Name | Data Quality Score | Rank |
| Henderson County Fire Department | 93.04 | 1 |
| Chattanooga Fire Department | 91.96 | 2 |
| Blount County Fire Protection District | 90.80 | 3 |
| Lawrenceburg Fire Department | 90.71 | 4 |
| Collierville Fire and Rescue | 90.18 | 5 |
| Fire Department Name | Rank | |
| Karns Fire Department | 1 | |
| Smyrna Fire Department | 2 | |
| Putnam Cnty VFD | 3 | |
| Williamson Fire and Emergency Services | 4 | |
| Paris Fire Dept | 5 |
To qualify for any of these superlatives, a fire department must have had an average of 12 incidents during the study period (1 year for top ten, 2 years for most improvement, and 10 years for ten year data quality).